
Within Shiftbase you can turn almost all available data into reports. Through this you can easily gain insight in your scheduling, time-tracking, and HR data.
Contents
Permissions
In the permissions, you can define who is allowed to view the reports within Shiftbase.

Running reports
To run a new report, go to the Reports tab. Here you can select a report in the top left corner under Report dashboard.
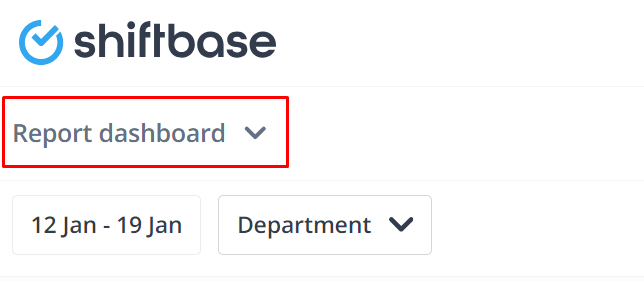
Once you have chosen the report you want, you can fill in the Filters at the top.

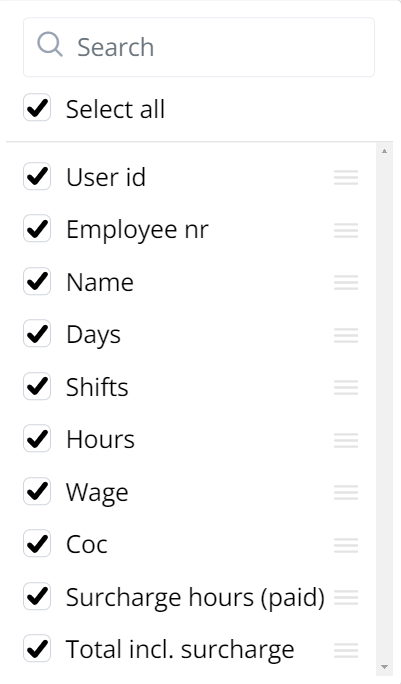
The Filters are different for each report. If you only select the period you'd like to run the report on and don't select any other Filters, it will automatically export all the data available. On the top right you can determine the Columns selection:
After you've selected the desired Filters and columns, you can click on the button on the right named +Run report.
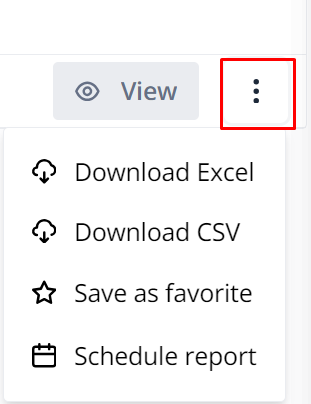
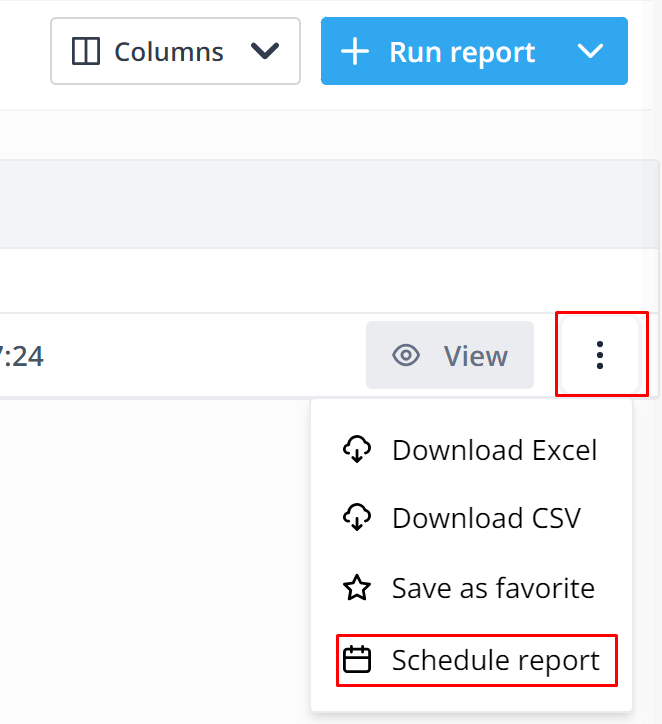
After the Report is done loading, you'll see three dots on the right side which allow you the take a Preview in Shiftbase of the report or export the report via Excel / CSV.
💡 Tip: All reports are nicely structured in categories, so you can find the desired topic quicker.
Saving favorites
Suppose you use the Timesheet detail report with specific Filters and Columns every week for monitoring. This report with your Filter and Column selection can be saved as one of your favourites. This allows you to easily find and retrieve this report.
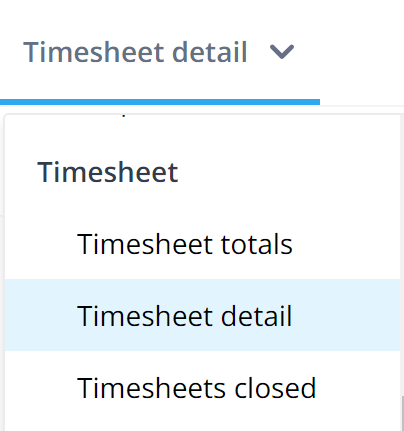
First you select the Timesheet detail report. Then set up the Filters and Columns.
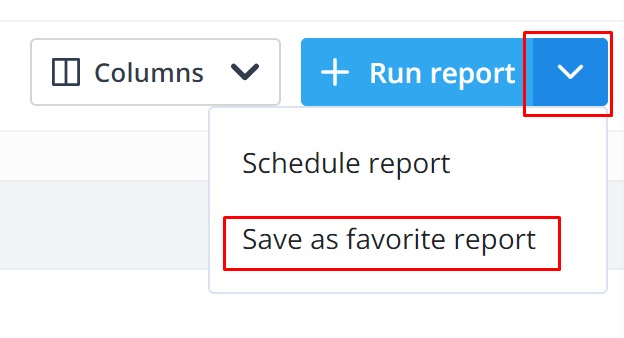
Once you have completed these steps click on the arrow symbol on the +Run report button. This will give you the option to save this current report as one of your favorites.
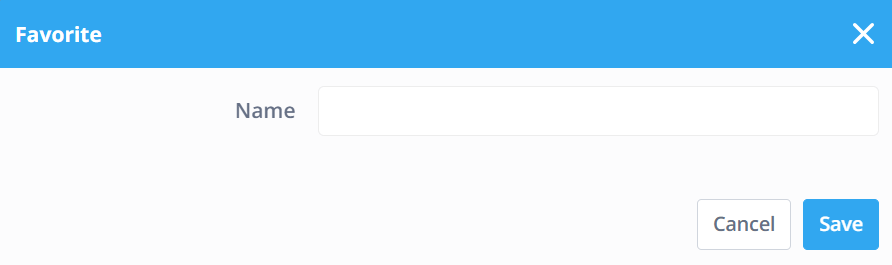
Once you clicked on Save as favorite report a modal will appear with the option to name this report. After naming the report do not forget to click on Save.
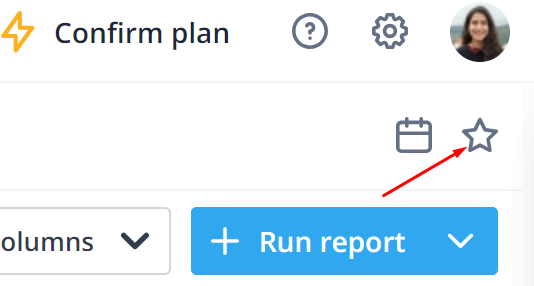
By clicking on the star symbol on the top right a modal will appear with all your favorites.
Here you can select your favorite reports. When you click on Load the report and all it's filters and columns are selected. Now you can edit the Period filter and click on Run report to request your favorite report.
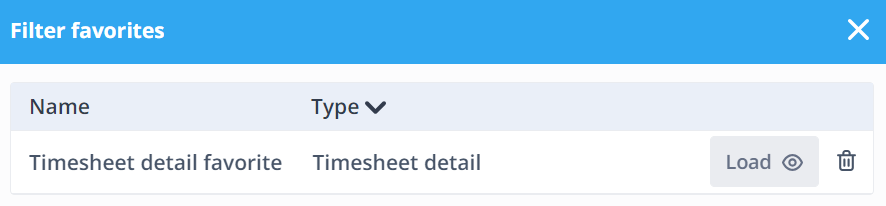
If one of the favourite reports is no longer required, you can easily delete it via the trash symbol.
Schedule reports
It is also possible to schedule reports. For example, you can choose to have a weekly timesheet totals report of the previous week ready on Monday. You can then always find these in the reports.
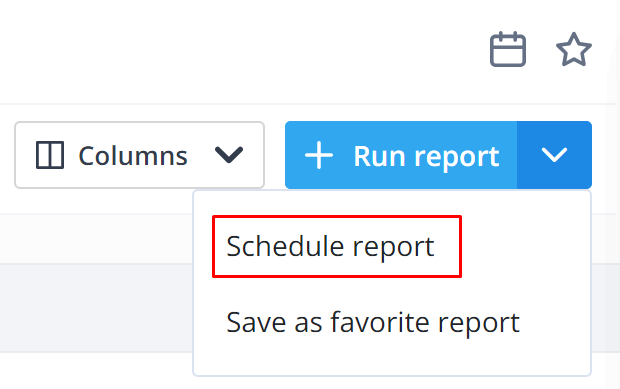
I will use the above as an example. In the Reports tab, select the desired Report in the top left-hand corner (example: Timesheet detail).
Then click on the arrow next to the button + Run report. Here you can select Schedule report.
Then the following modal appears.
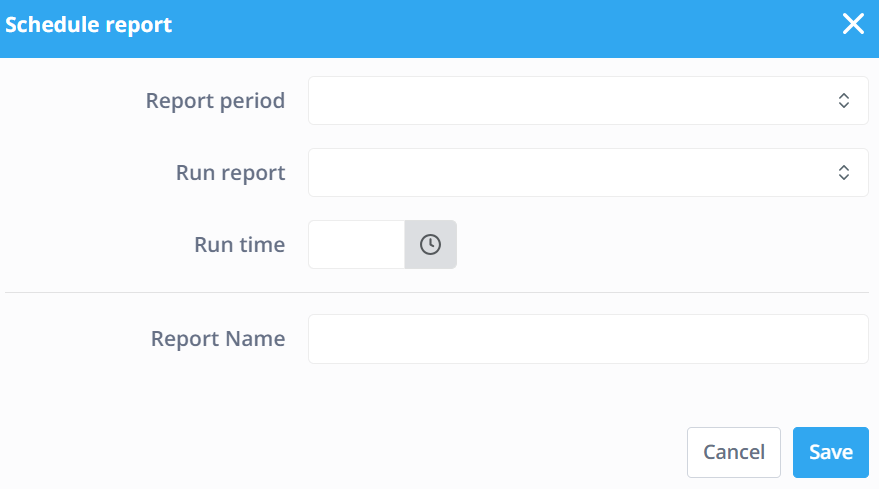
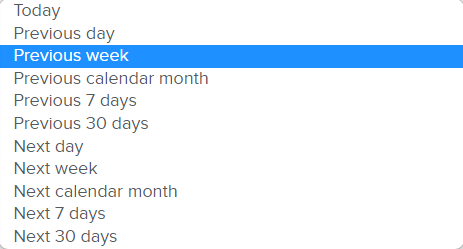
At Report period you select which period the report should contain. Here you have the following choices.
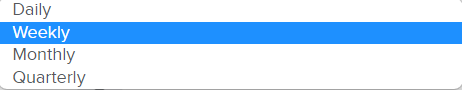
At Run report you can specify when the report should be requested. The following options are available.
If weekly reporting is selected, the On field is also displayed. Here you can schedule on which day the report is requested. The Run time specifies the time at which the report is requested. Under Report name you can give this scheduled report a name.
When you're done, press Save.
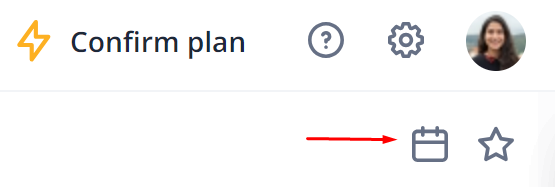
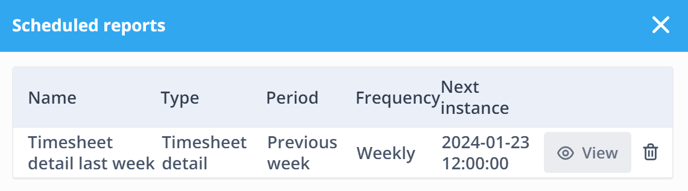
The report can then be retrieved using the calendar icon.
On this screen, you can use the bin icon to remove the recurring report. View takes you directly to the correct report screen.
Of course it is also possible to schedule a report that you have already run. This can be done by clicking on the three points behind the requested report. Here you can choose Schedule report. A scheduled report can be recognised by the repeat icon to the left of the View button.
Reports from integrations
Are you using one of our payroll integrations? Then you can easily obtain the required payroll data for the provider that you use via a designated report. That way you have all the data you need to pay your employees.
